Are you fed up with the same old BI tools like Tableau and PowerBI? Then, welcome to the Grafana fan club—a refreshing twist in the world of analytics and monitoring! Grafana isn’t just any platform; it’s an open-source wonder that lets you query, visualize, alert on, and understand your metrics, no matter their hiding spots. Dive into creating, exploring, and sharing dashboards that not only look cool but also make you the hero of data-driven decision-making. Here’s why Grafana stands out from the crowd:
Open Source Magic: Wave goodbye to those pricey subscriptions! Grafana is open-source, meaning you can keep your wallet happy and your data happier. And let’s be honest, in the world of UI/UX design, Tableau still feels like it’s using a map to find the ‘start’ button.
Community Strength: Ever feel lonely in the data jungle? Not with Grafana! Join a community brimming with enthusiasts eager to lend a hand, share a plugin, or offer a data-driven shoulder to cry on.
Plugin Paradise: Need more bells and whistles? Grafana’s robust library of plugins is like a Swiss Army knife for your data—always ready to extend your capabilities.
Diverse Data Sources: Whether it’s Graphite, Prometheus, InfluxDB, or Elasticsearch, Grafana speaks fluent data from nearly any source you can throw at it.
Alert Like a Pro: With Grafana’s sophisticated alerting system, you can set alerts that make even the most stoic data sit up and take notice.
Ready to break up with your old BI tools? Grafana is your new data-soulmate waiting to sweep you off your feet!
Fugue Grafana: A Journey From Zero to Hero
Aight folks, let’s start preparing for the Grafana journey. We’ll be covering the following topics:
Getting Started: Installation, setup, and configuration of Grafana.
Data Sources: Connecting Grafana to various data sources.
Dashboards: Creating and customizing dashboards.
Plugins: Extending Grafana’s functionality with plugins.
Alerting: Setting up alerts for your data.
Getting Started
Grafana is a breeze to install and set up. You can choose from various installation methods, including Docker, RPM/DEB packages, and even cloud services like AWS and Azure. Once you’ve installed Grafana, you can access it via your browser and start configuring it to your heart’s content. Here is a quick guide to get you started: Grafana Installation Guide.If you are really in a hurry and want to get started right away before reading the installation guide, you can use the following Docker command to get Grafana up and running: docker run -d -p 3000:3000 grafana/grafana. After running this command, you can access Grafana by navigating to http://localhost:3000 in your browser.
If you set up Grafana successfully, you should see the login page as shown below:
What? are you asking me for the default username and password? Well, I don’t want to spoil the fun for you. Go ahead and find it out yourself. If you still can’t find it, you can always refer to the Grafana documentation or leave me a comment below and I will teach you hands-on.
Data Sources
Grafana supports a wide range of data sources, including Graphite, Prometheus, InfluxDB, Elasticsearch, and many more. You can easily connect Grafana to these data sources by configuring the data source settings in Grafana. Here is a quick guide to help you get started: Grafana Data Sources Guide.
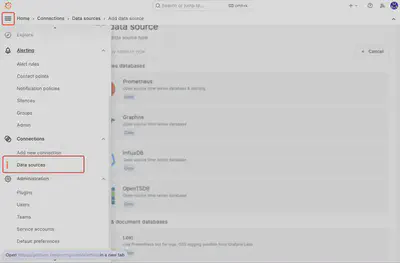
How to Add a Data Source: To add a data source, navigate to the Configuration > Data Sources page in Grafana and click on the “Add data source” button as shown in the image below.
Select the data source you want to add, configure the data source settings, and click on the “Save & Test” button to save the data source settings. Grafana actually provides a lot of options to configure the data source settings, so make sure to explore them to get the most out of your data source. Here in this example we will be using Prometheus as our data source. Note: Here we assume that you have correctly set up Prometheus and it is running on your local machine. If you haven’t set up Prometheus yet, you can refer to the Prometheus documentation to get started.
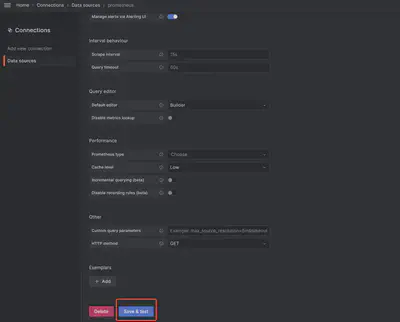
But wait, why do we need Prometheus as our data source? Well, Prometheus is a popular monitoring and alerting tool that is widely used in the industry. It is a great choice for monitoring your applications and infrastructure, and Grafana provides excellent support for Prometheus. So, since our topic is to cover how you can set up grafana for monitoring your server metrics, we will be using Prometheus as our data source. In the image below, you can see how we have configured Prometheus as our data source in Grafana. Since we are running Prometheus on our local machine, we’ll just skip the TLS/SSL settings and click on the “Save & Test” button to save the data source settings as shown in the image below. I really like the way Grafana provides a test button to test the data source settings. It makes it easy to verify if the data source is correctly configured or not.
Dashboards
Dashboards are the heart and soul of Grafana. They allow you to visualize your data in a meaningful way and gain insights from it. You can create custom dashboards in Grafana by adding panels that display your data in various formats like graphs, tables, and gauges. Here is a quick guide to help you get started: Grafana Dashboards Guide.
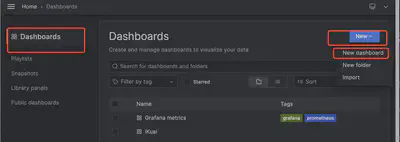
How to Create a Dashboard: To create a dashboard, navigate to the Create > Dashboard page in Grafana and click on the “Add new panel” button as shown in the image below.
How to Use a Pre-built Dashboard: Grafana also provides a library of pre-built dashboards that you can use to monitor your data. You can import these dashboards into Grafana by navigating to the Create > Dashboard page and clicking on the “Import” button as shown in the image below. You can then upload the JSON file into the text area and click on the “Load” button to import the dashboard. If you have the dashboard ID, you can also import the dashboard by navigating to the Create > Dashboard page and clicking on the “Import” button as shown in the image below. You can then enter the dashboard id in the text area and click on the “Load” button to import the dashboard. In the image below, you can see how we have imported a pre-built dashboard into Grafana.
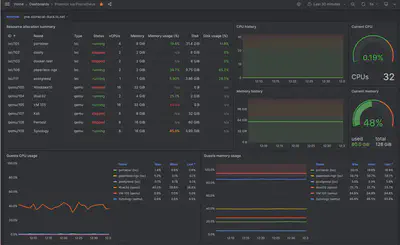
After Creating a Dashboard: Once you have created a dashboard, you can customize it by adding panels, changing the layout, and configuring the panel settings. You can also share the dashboard with others by exporting it as a JSON file or embedding it in a web page. In the image below, you can see how we have customized a dashboard in Grafana. This is an example of a dashboard that displays server metrics collected by Prometheus from PVE Exporter. This is used to monitor my home server and keep an eye on the server metrics like CPU usage, memory usage, disk usage, and network traffic. (To Dell: If you could have just provide user with a better ipmi tool, I wouldn’t have to use PVE Exporter to monitor my server. But anyways, I am happy with the setup now.)
Figure: Proxmox Server Metric Monitoring Dashboard
In the example above, you can easily see the metric values like CPU usage, memory usage, disk usage, and network traffic. By looking at the dashboard, I can easily tell that the Memory Usage of my qemu/109 is quite high. As a DevOp, you better know what to do when you come across this situation. I would log into the guest machine and pull out the memory usage of the processes running on the machine to identify the culprit. Well I can guarantee you that I don’t have culprit or malware running on my machine. It’s just that I had too much stuff stored in the Disk and Synology DSM was probably doing some background cleaning and sorting tasks.
Now that you have a basic understanding of how to create and customize dashboards in Grafana, you can start exploring the various features and options available in Grafana to create stunning visualizations of your data. Remember, the sky’s the limit when it comes to Grafana dashboards!
Fugue Prometheus: From Raw Metrics to Symphony of Insights
You might wonder why it sounds so easy to set up a Grafana Dashboard. Well, the secret sauce behind this is Prometheus. Prometheus is an open-source monitoring and alerting toolkit that is widely used in the industry. It provides a powerful data model, a flexible query language, and a sophisticated alerting system that makes it easy to monitor your applications and infrastructure. Prometheus collects metrics from your applications and infrastructure and stores them in a time-series database. You can then query these metrics using the Prometheus query language and visualize them in Grafana. This is why Prometheus is a great choice for monitoring your server metrics and Grafana is a great choice for visualizing these metrics. Together, they make a powerful combination that can help you monitor and troubleshoot your applications and infrastructure with ease. And I gotta be honest with you that it took me a while to properly set up Prometheus and PVE Exporter to monitor my Proxmox server. If you come across any issues while setting up Prometheus, here is a hint: Check the certificates and user permission. I know this sounds like a generic hint, but trust me, it can save you a lot of time.
But in order to monitor your server metrics, there are a few additional set up that you need to do. You need to install Prometheus on your server and configure it to collect metrics from your applications and infrastructure. How to do that? Well, you can refer to the Prometheus documentation to get started. Or you can follow this GitHub Repo Prometheus-PVE-Exporter. These tutorials will guide you through the process of installing Prometheus on your server and configuring it to collect metrics from your applications and infrastructure. Once you have Prometheus set up and running, you can configure Grafana to connect to Prometheus and start visualizing your server metrics. And that’s how you can set up Grafana for monitoring your server metrics using Prometheus. This is specifically useful for monitoring your Proxmox server metrics. Below is my Prometheus configurations for monitoring my Proxmox server metrics. You can see that I have configured Prometheus to scrape the metrics from PVE Exporter, which is running on my Proxmox server. This is how Prometheus collects the metrics from my Proxmox server and stores them in a time-series database. You can then query these metrics using the Prometheus query language and visualize them in Grafana. This is how I monitor my Proxmox server metrics using Grafana and Prometheus. If you have any questions or need help setting up Prometheus and Grafana for monitoring your server metrics, feel free to leave me a comment below. I’ll be happy to help you out.
global:scrape_interval:15s# Set this wisely because it will affect the performance of your server.evaluation_interval:15s# Evaluate rules every 15 seconds. The default is every 1 minute.# scrape_timeout is set to the global default (10s).# Alertmanager configurationalerting:alertmanagers:- static_configs:- targets:# - alertmanager:9093rule_files:# - "first_rules.yml" This is where you can define your rule files. I would recommend you to keep your rules in a separate file and include them here. Since I am don't have a sophisticated setup, I have kept my rules in the same file.# - "second_rules.yml"scrape_configs:# Job No. 1: Scrape the Prometheus server itself.- job_name:"prometheus"static_configs:- targets:["localhost:9090"]# Job No. 2: Scrape the Proxmox server metrics using PVE Exporter.- job_name:'pve'static_configs:- targets:- pve.you-do-not-have-permission.ts.net # Proxmox host. You can replace this with your Proxmox VE host. Since I am using Tailscale, I have used the hostname provided by Tailscale.metrics_path:/pvescheme:'https'params:module:[default]relabel_configs:- source_labels:[__address__]target_label:__param_target- source_labels:[__param_target]target_label:instance- target_label:__address__replacement:portainer.stonecat-duck.ts.net:9221 # PVE Exporter host. You can replace this with your PVE Exporter host. This is the port that PVE Exporter is running on.# Job No. 3: Scrape the Traefik metrics using Traefik Exporter.- job_name:'traefik'scrape_interval:15sscrape_timeout:10smetrics_path:/metricsscheme:httpstatic_configs:- targets:["another-service:$PORT NUMBER"]# Traefik host. You can replace this with your Traefik host.basic_auth:# Basic authentication. You can replace this with your basic authentication credentials. Not advised to use basic authentication. Use a more secure method but here I am running all of the service in local network and I am the only user, I will just skip the security part.username:username-for-realpassword:nobody-should-know-this# Job No. 4: Scrape the Nvidia GPU metrics using Nvidia GPU Exporter.- job_name:'Tesla M40'static_configs:- targets:['your-gpu-host:9835']# Nvidia GPU host. You can replace this with your Nvidia GPU host. This is the port that Nvidia GPU Exporter is running on. Make sure this is the correct address and port. Here I was running the Nvidia GPU Exporter on my Nvidia GPU host which is not the same as my PVE Exporter host.
You probably need to tweak the configurations according to your setup. But this is how I have set up Prometheus to scrape the metrics from my Proxmox server using PVE Exporter. As I am using Docker, all I need to do is to mount the configuration file to the Prometheus container and start the container. Below is the docker-compose.yml file that I used to start the Prometheus container. It Only Contained the Prometheus Service. I have other services running as well. So Tweak it based on your need.
version:"3.8"volumes:prometheus-data:driver:localservices:prometheus:image:prom/prometheus:latestcontainer_name:prometheushostname:prometheusnetworks:- monitoring_networklabels:- "traefik.enable=true"- "traefik.http.routers.prometheus.rule=Host(`portainer.stonecat-duck.ts.net`)&&PathPrefix(`/prometheus`)"- "traefik.http.services.prometheus.loadbalancer.server.port=9090"- "traefik.http.routers.prometheus.entrypoints=web"ports:- "9090:9090"# You may use other ports as well. I have used 9090 because it is the default port for Prometheus.volumes:- /root/prometheus/config:/etc/prometheus/config#This is where I have stored my Prometheus configuration file. You can replace this with your configuration file path. Incorrect configuration file path will result in an error. The behavior of Prometheus is to not able to scrape the metrics from the target.- /root/tsCert/:/etc/prometheus/cert/#This is where I have stored my certificates. You can replace this with your certificate path. Incorrect certificate path will result in an error. The behavior of Prometheus is to not able to scrape the metrics from the target.- prometheus-data:/prometheusrestart:unless-stoppedcommand:- "--config.file=/etc/prometheus/config/prometheus.yml"# The container need to know where the configuration file is stored. This is the path to the configuration file. Make sure this is the correct_path in your container not your host machine.#Something Else Herenetworks:traefik_network:external:truemonitoring_network:driver:bridge
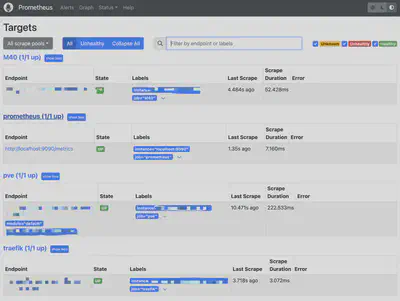
By properly setting up Prometheus and Grafana, you can monitor your server metrics with ease and gain valuable insights into the performance of your applications and infrastructure. We can go to the Prometheus WEBUI and see the metrics that Prometheus is scraping from the target. This is how you can monitor your server metrics using Grafana and Prometheus. Below is a screenshot of my Prometheus target page. As you can see currently every tartget that I monitor is up. If you see any target down, you need to check the configurations and make sure that the target is up and running. If the target is down, Prometheus will not be able to scrape the metrics from the target and you will not be able to visualize the metrics in Grafana. So make sure that all your targets are up and running.
Figure: Prometheus Targets
Epilogue: This is Just the Beginning
Congratulations! You’ve taken your first steps into the world of Grafana and Prometheus. But remember, this is just the beginning of your journey. There’s so much more to explore and learn in the realm of monitoring and alerting. Dive deeper into the world of Grafana plugins, explore the vast landscape of data sources, and master the art of creating stunning dashboards that tell a story. And don’t forget to share your knowledge with others in the Grafana community. Together, we can build a world where data is not just a number but a powerful tool for change. So go forth, brave explorer, and chart your course through the data-driven universe with Grafana and Prometheus as your trusty companions. Happy monitoring!